NAME:
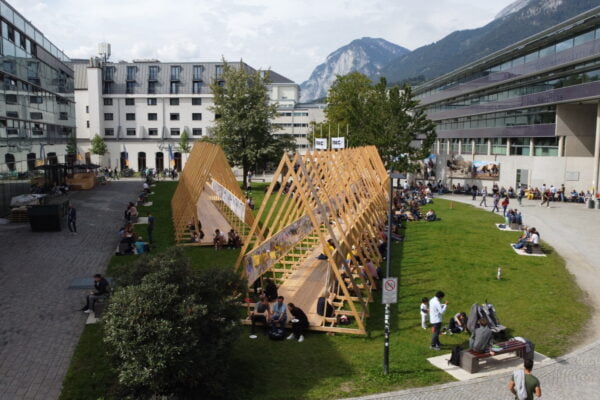
SOWI - Garden
BUILDING:
SOWI
FLOOR:
0
TYPE:
Garden
CAPACITY:
2000
ACCESS:
Public Access
EQUIPMENT:
---
Gravitational mass movements and hydrological processes erode material on hillslopes and transport it to areas of deposition. By doing so, they contribute to soil formation and shape landscapes on different time scales depending on their magnitude and frequency. Among these processes are debris flows and rainfall runoff, but also full-depth avalanches. In this case, not the material itself is moving, but the snow cover, that glides over the ground and can take up sediment. In the process, glide avalanches become so-called “dirty snow avalanches”.
While conventional field methods such as snow sampling and mapping deposits on printed aerial images have been applied to estimate the amount of soil erosion by dirty snow avalanches, the specific patterns of erosion and deposition they produce remain poorly quantified.
This study aims to bridge this gap by applying structure from motion photogrammetry in order to create DoDs and map areas of erosion and deposition more accurately. Furthermore, snow sampling was employed to quantify the sediment volume transported by the avalanches.
We will present preliminary results from the avalanches we observed and sampled. This includes point cloud comparisons of the time soon after the event and when the avalanche has melted.
We and use cookies and other tracking technologies to improve your experience on our website. We may store and/or access information on a device and process personal data, such as your IP address and browsing data, for personalised advertising and content, advertising and content measurement, audience research and services development. Additionally, we may utilize precise geolocation data and identification through device scanning.
Please note that your consent will be valid across all our subdomains. You can change or withdraw your consent at any time by clicking the “Consent Preferences” button at the bottom of your screen. We respect your choices and are committed to providing you with a transparent and secure browsing experience.