NAME:
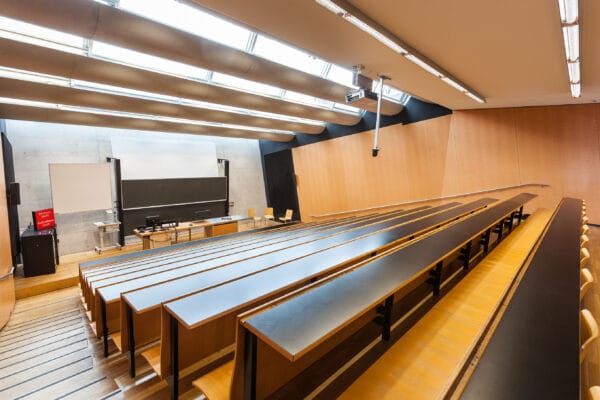
SOWI - HS 1
BUILDING:
SOWI
FLOOR:
0
TYPE:
Lecture Hall
CAPACITY:
160
ACCESS:
Only Participants
EQUIPMENT:
Beamer, PC, WLAN (Eduroam), Overhead, Flipchart, Blackboard, Sound System, Handicapped Accessible, Microphones
In this study we use repeat high resolution airborne LiDAR and orthophotos to study changes in glacier area and surface elevation for the period ~2010 to ~2020. The earliest survey year is 2007 and the latest survey year is 2022. The mean (median) number of years surveyed is 9.5 (10) years. Our study area covers over a third of the glacier area in Norway and three of the GTN-G glacier sub-regions 08-01, -02 and -03. We derive glacier outlines from the time of survey using high resolution orthophotos. In cases where orthophotos are lacking or snow conditions are severe, we use satellite data or LiDAR data to derive glacier outlines. We demonstrate the importance of using updated glacier outlines due to retreat of glaciers compared to the RGI inventory. Elevation change results are in most cases more negative when using updated glacier masks corresponding to the period of comparison. We compare our surface elevation changes using repeat LiDAR with global studies using repeat ASTER.
We and use cookies and other tracking technologies to improve your experience on our website. We may store and/or access information on a device and process personal data, such as your IP address and browsing data, for personalised advertising and content, advertising and content measurement, audience research and services development. Additionally, we may utilize precise geolocation data and identification through device scanning.
Please note that your consent will be valid across all our subdomains. You can change or withdraw your consent at any time by clicking the “Consent Preferences” button at the bottom of your screen. We respect your choices and are committed to providing you with a transparent and secure browsing experience.